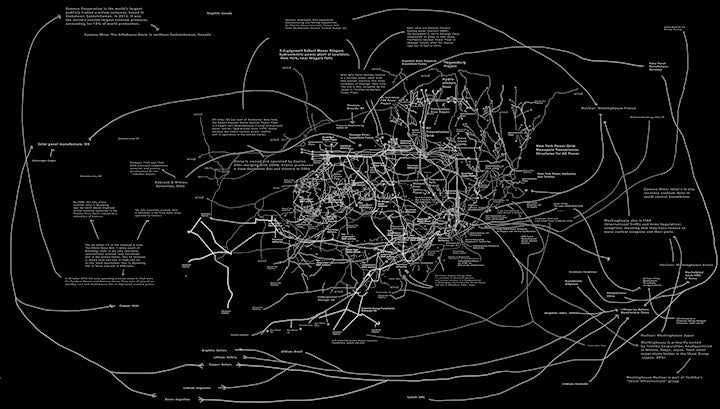
In 2018 and 2019, Swale was my mobile, public studio. I mapped the energy grid, photographed still lives, made dyes and inks from plants, and met so many wonderful people from around the world. It took 23 hours of projector and computer use to trace the drawing onto the wall for a commission at the Ace Hotel in NY mapping New York's energy consumption.
This drawing maps the complex and decentralized production system for New York City’s electrical energy inputs. These connections and circuitous routes are continually changing as world markets and political situations fluctuate. The drawing references the impermanence of a chalkboard to imply the energy economy’s fluctuations: based on markets, policy, and votes. This drawing just touches on the global supply chain of the physical equipment carrying energy in these systems. Iron Ore is mined worldwide, and other minerals or rare earths are mined wherever it’s most affordable at the time. Currently, minerals used in battery technology to retain excess in power systems are being extracted plentifully from Brazil, Argentina, Bolivia, and the Democratic Republic of Congo.
Most of the energy that New Yorkers use comes from natural gas or petroleum. 1/3rd is obtained from nuclear sources, and about 20% is obtained from the 180 hydroelectric facilities in and around the state. Wind generates 2% of the city’s energy, while solar and renewables like biomass generate about 2%. Coal generates less than 1%. As I write this, New York City is setting new standards for buildings: by 2024, buildings will be required to meet emissions limits or face expensive fines.
New York State’s Clean Energy Standard was revised this year to require 100% carbon-free electricity by 2040. The US Energy Information Administration claims 29% of New York’s in-state generation. This happens at both large- and small-scale facilities and comes from renewable sources.

